Table Extraction Accuracy from Scanned PDFs
Structure recognition, not OCR accuracy, is where table extraction fails.
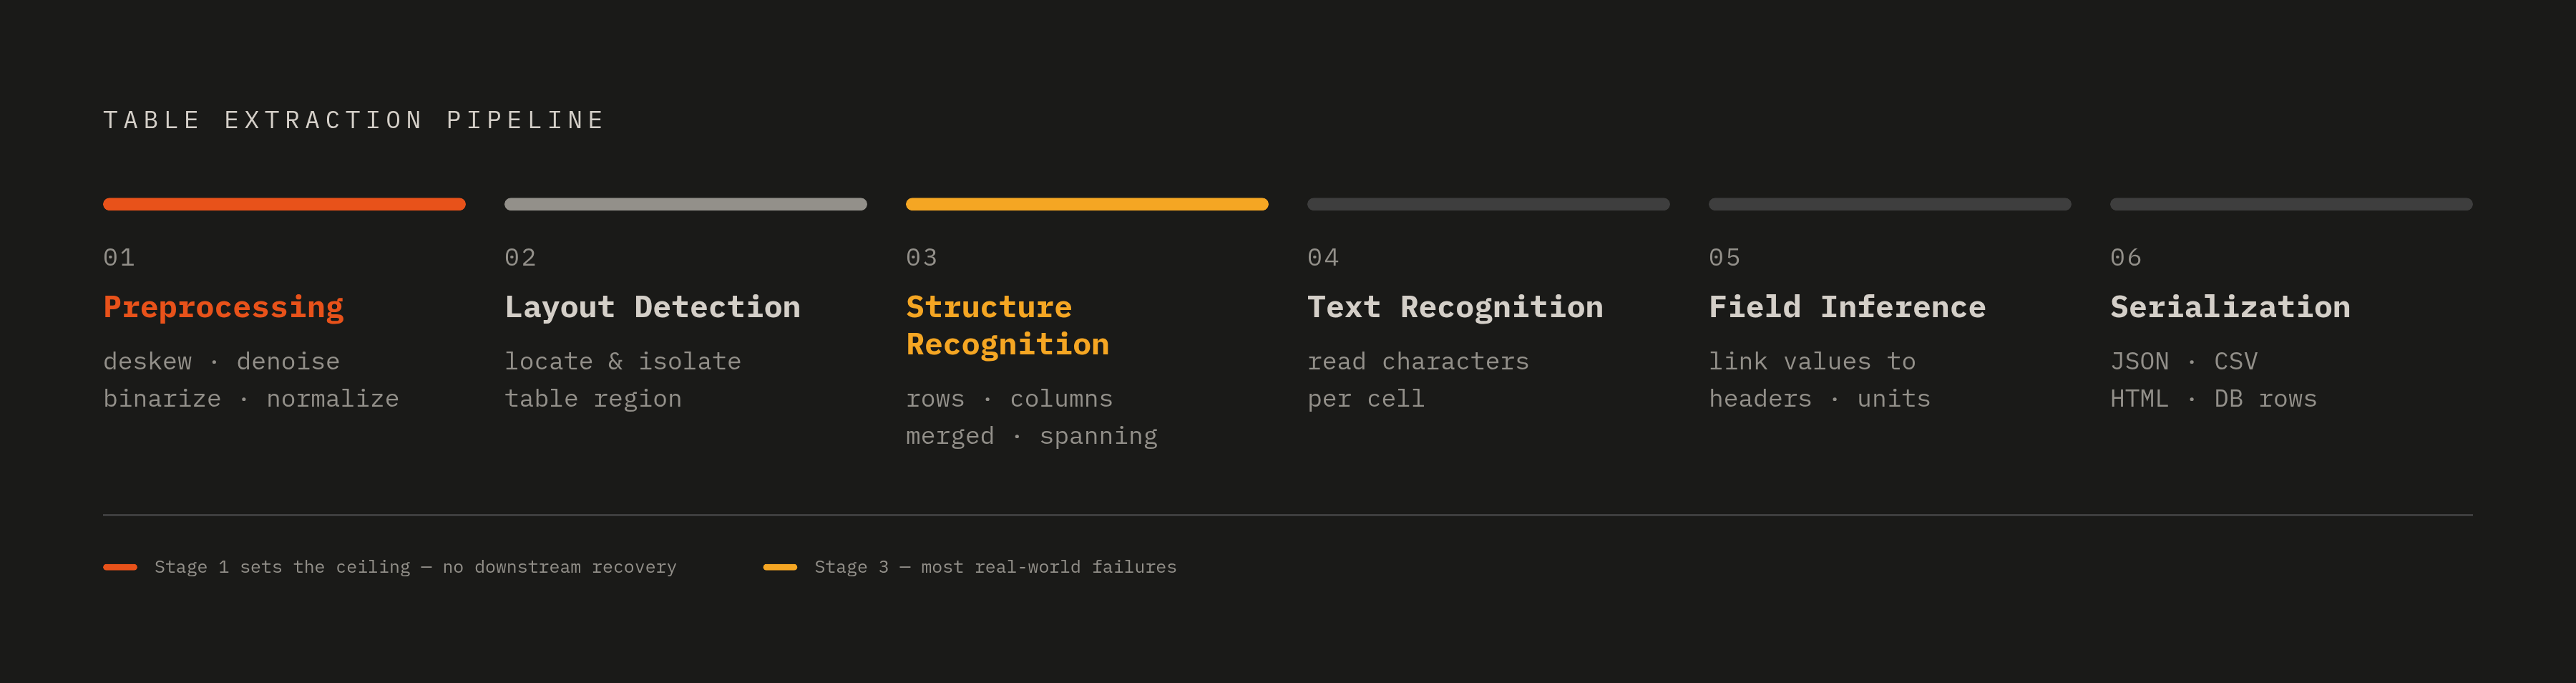
Start with preprocessing. Before any text gets read, the image needs deskewing, denoising, binarization, and resolution normalization. This stage sets a ceiling nothing downstream can raise. A scanned page tilted three degrees, a photocopy with uneven lighting, a compression artifact that blurs a column of decimal points: no clever model further down the pipeline recovers information that was never legible to begin with.
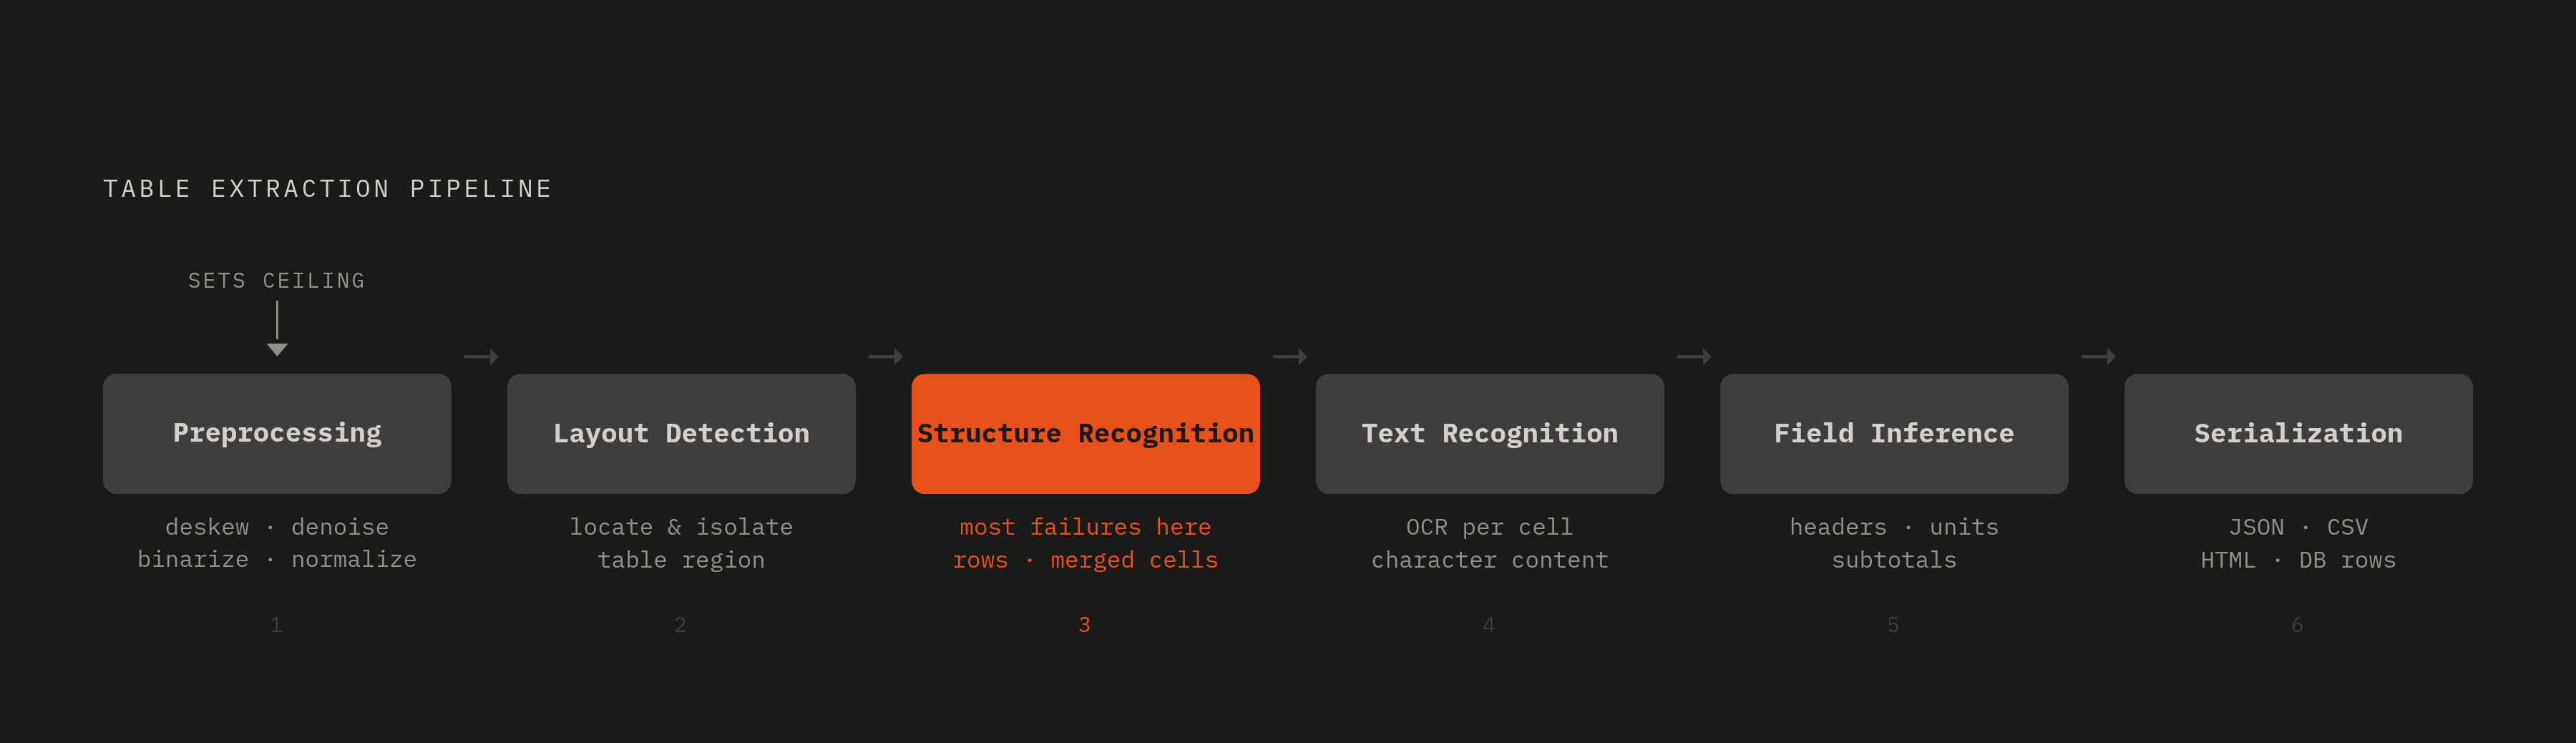
The pipeline runs six sequential stages: preprocessing (deskewing, denoising, binarization, and resolution normalization), layout detection to locate and isolate the table on the page, table structure recognition to rebuild the logical grid of rows and columns and merged cells, text recognition to read character content inside each cell, field relationship inference to determine what each value means and which header governs it, and finally output serialization into JSON, CSV, HTML, or database rows. The ceiling on everything downstream is set at the first stage; no model later in the chain recovers information that preprocessing failed to preserve. Most real-world failures, however, live at the structure recognition stage, where a system can read every character correctly and still return a table that is structurally broken because it misjudged cell boundaries, collapsed spanning headers, or lost continuation rows across pages.
Next comes layout detection, sometimes called page segmentation. It figures out where on the page a table sits and separates it from body text, figure captions, footnotes, and running headers. Get this wrong and the pipeline either tries to parse a paragraph as a grid, or clips the bottom two rows off a table because it mistook them for footer text.
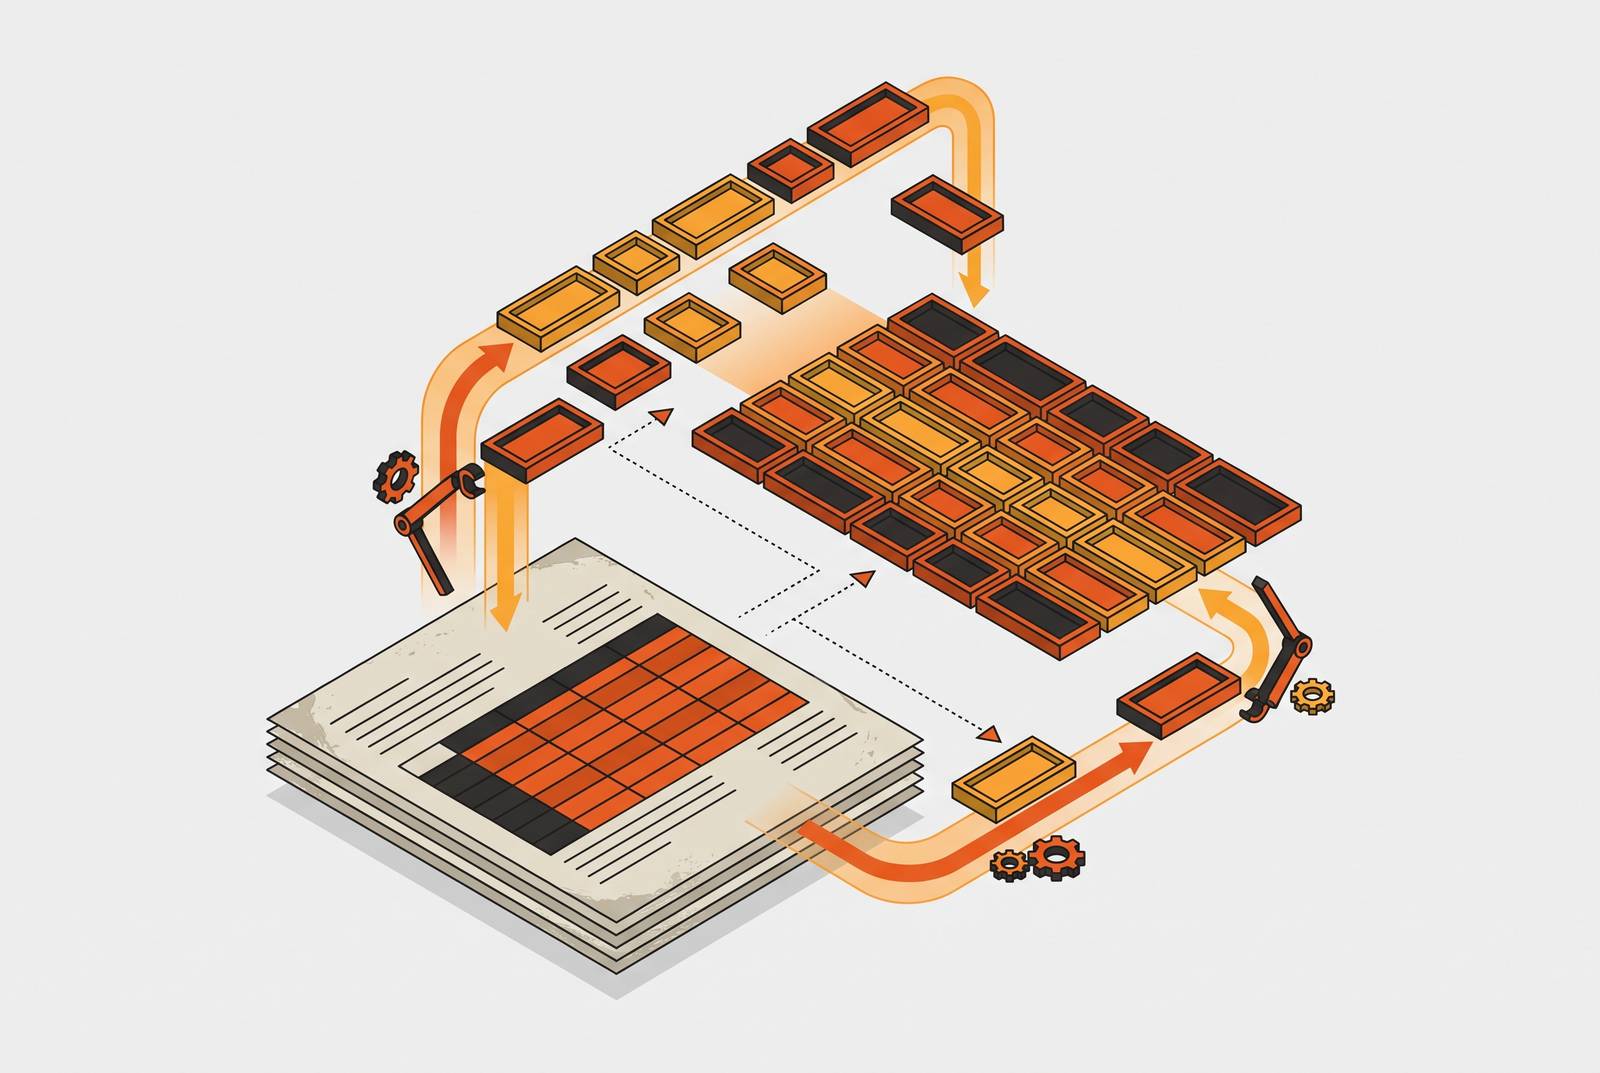
Table structure recognition follows, and it's a genuinely different problem from reading characters. This stage rebuilds the logical grid, meaning rows, columns, merged cells, and spanning headers, from the region the previous stage flagged. A system can nail every letter and digit and still hand back a table that's structurally wrong, and that gap is where most real-world failures actually live.
Text recognition itself comes next, reading the character content inside each cell once the grid is known. Field relationship inference comes after that: deciding what a cell value actually means, which header governs it, what unit it carries, whether it's a line item or a subtotal. Finally, output serialization turns the reconstructed table into something a downstream system or agent can use, whether that's JSON, CSV, HTML, or rows in a database.
Modern vision-language model pipelines often fold several of these stages into one forward pass. That doesn't make the underlying failure modes disappear; it just moves them somewhere else, usually somewhere harder to diagnose. Some pipeline designs go the other direction and make the stage separation explicit, with each component swappable on its own. That's the right design choice, and it's worth studying even for teams building on a single end-to-end model, because it names the problems a monolithic system is quietly solving, or failing to solve, all at once.
Where does OCR quality set the ceiling, and what do modern vision-language models change?
Classical OCR reads flat text streams. It has no built-in notion of a table, a cell boundary, or the fact that reading order across a grid isn't the same as reading order down a page. Fed a table, an older OCR engine will often just return words in roughly the order they sit on the page, ignoring spatial structure entirely, and leave the rebuild job to whatever comes next.
Vision-language models treat the page as a picture instead of a stream of characters to transcribe, and that shift is doing most of the real work behind the accuracy gains of the last two years, which is the extraction problem platforms like Extend supply specialized vision model APIs to address. Models including Qwen2.5-VL, InternVL2, and mPLUG-DocOwl 1.5 advanced significantly across 2024 and 2025 by handling layout, content, and structure in a single pass instead of stacking separate models on top of each other. The open-source numbers back this up. dots.ocr, released under an MIT license in July 2025, hit TableTEDS scores of 88.6 for English and 89.0 for Chinese on OmniDocBench. DeepSeek-OCR, a 3-billion-parameter model also released under MIT license in October 2025, processes up to 200,000 pages a day on a single A100 GPU and, in reported comparisons, beats larger frontier models on table parsing accuracy specifically. On the FinTabNet scanned-condition benchmark, TEDS-structure scores moved from 0.82 to 0.97 between older and newer open models running at 150 dpi. That's the difference between a system that works in production and one that doesn't.
There's a catch worth sitting with, though. When a VLM folds OCR and structure recognition into one step, average accuracy climbs, but the failure gets harder to isolate. A wrong output table might trace back to a misread character or a misjudged cell boundary, and a modular pipeline can usually tell you which; a single forward pass through a VLM often can't, not without extra instrumentation bolted on. Resolution still sets the same ceiling it always did. A low-dpi scan or a JPEG pass that smeared a ruling line bakes those artifacts in before the model ever sees the page, and downstream cleverness never un-smears them. The generation shift moved some of the pipeline's failure modes around rather than eliminating them, and it stacked new ones on top: context window limits on long tables, and outright hallucinated structure when a model gets asked to fill in a grid it can't fully see.
The table structure recognition problem: merged cells, spanning headers, and multi-page continuation
Structure recognition and text recognition are separate problems, and treating them as one is where most confidence in a tool's accuracy goes wrong. A system can read every character on a page correctly and still hand back a table that's structurally broken, because it misjudged where one cell ends and another begins.
Three failure patterns show up again and again. Merged cell collapse happens when a spanning cell, legitimately covering two rows or two columns, gets flattened into duplicated values or, worse, dropped rows entirely. Header hierarchy misreads happen when a table stacks two or three levels of column headers and the system treats the second header row as a data row, cutting the link between a label and the value it describes. Multi-page continuation is its own animal: a table running across four pages either loses its continuation rows because they got orphaned from the original header, or the repeating header on each new page gets mistaken for the start of a brand-new table.
These failure patterns are not exotic edge cases. Complex financial documents — multi-page tables with merged cells and repeating headers — are precisely the kind of input where tools most commonly flatten structure, drop continuation rows, or abandon structure recognition entirely. That's the category of document enterprises most need parsed correctly.
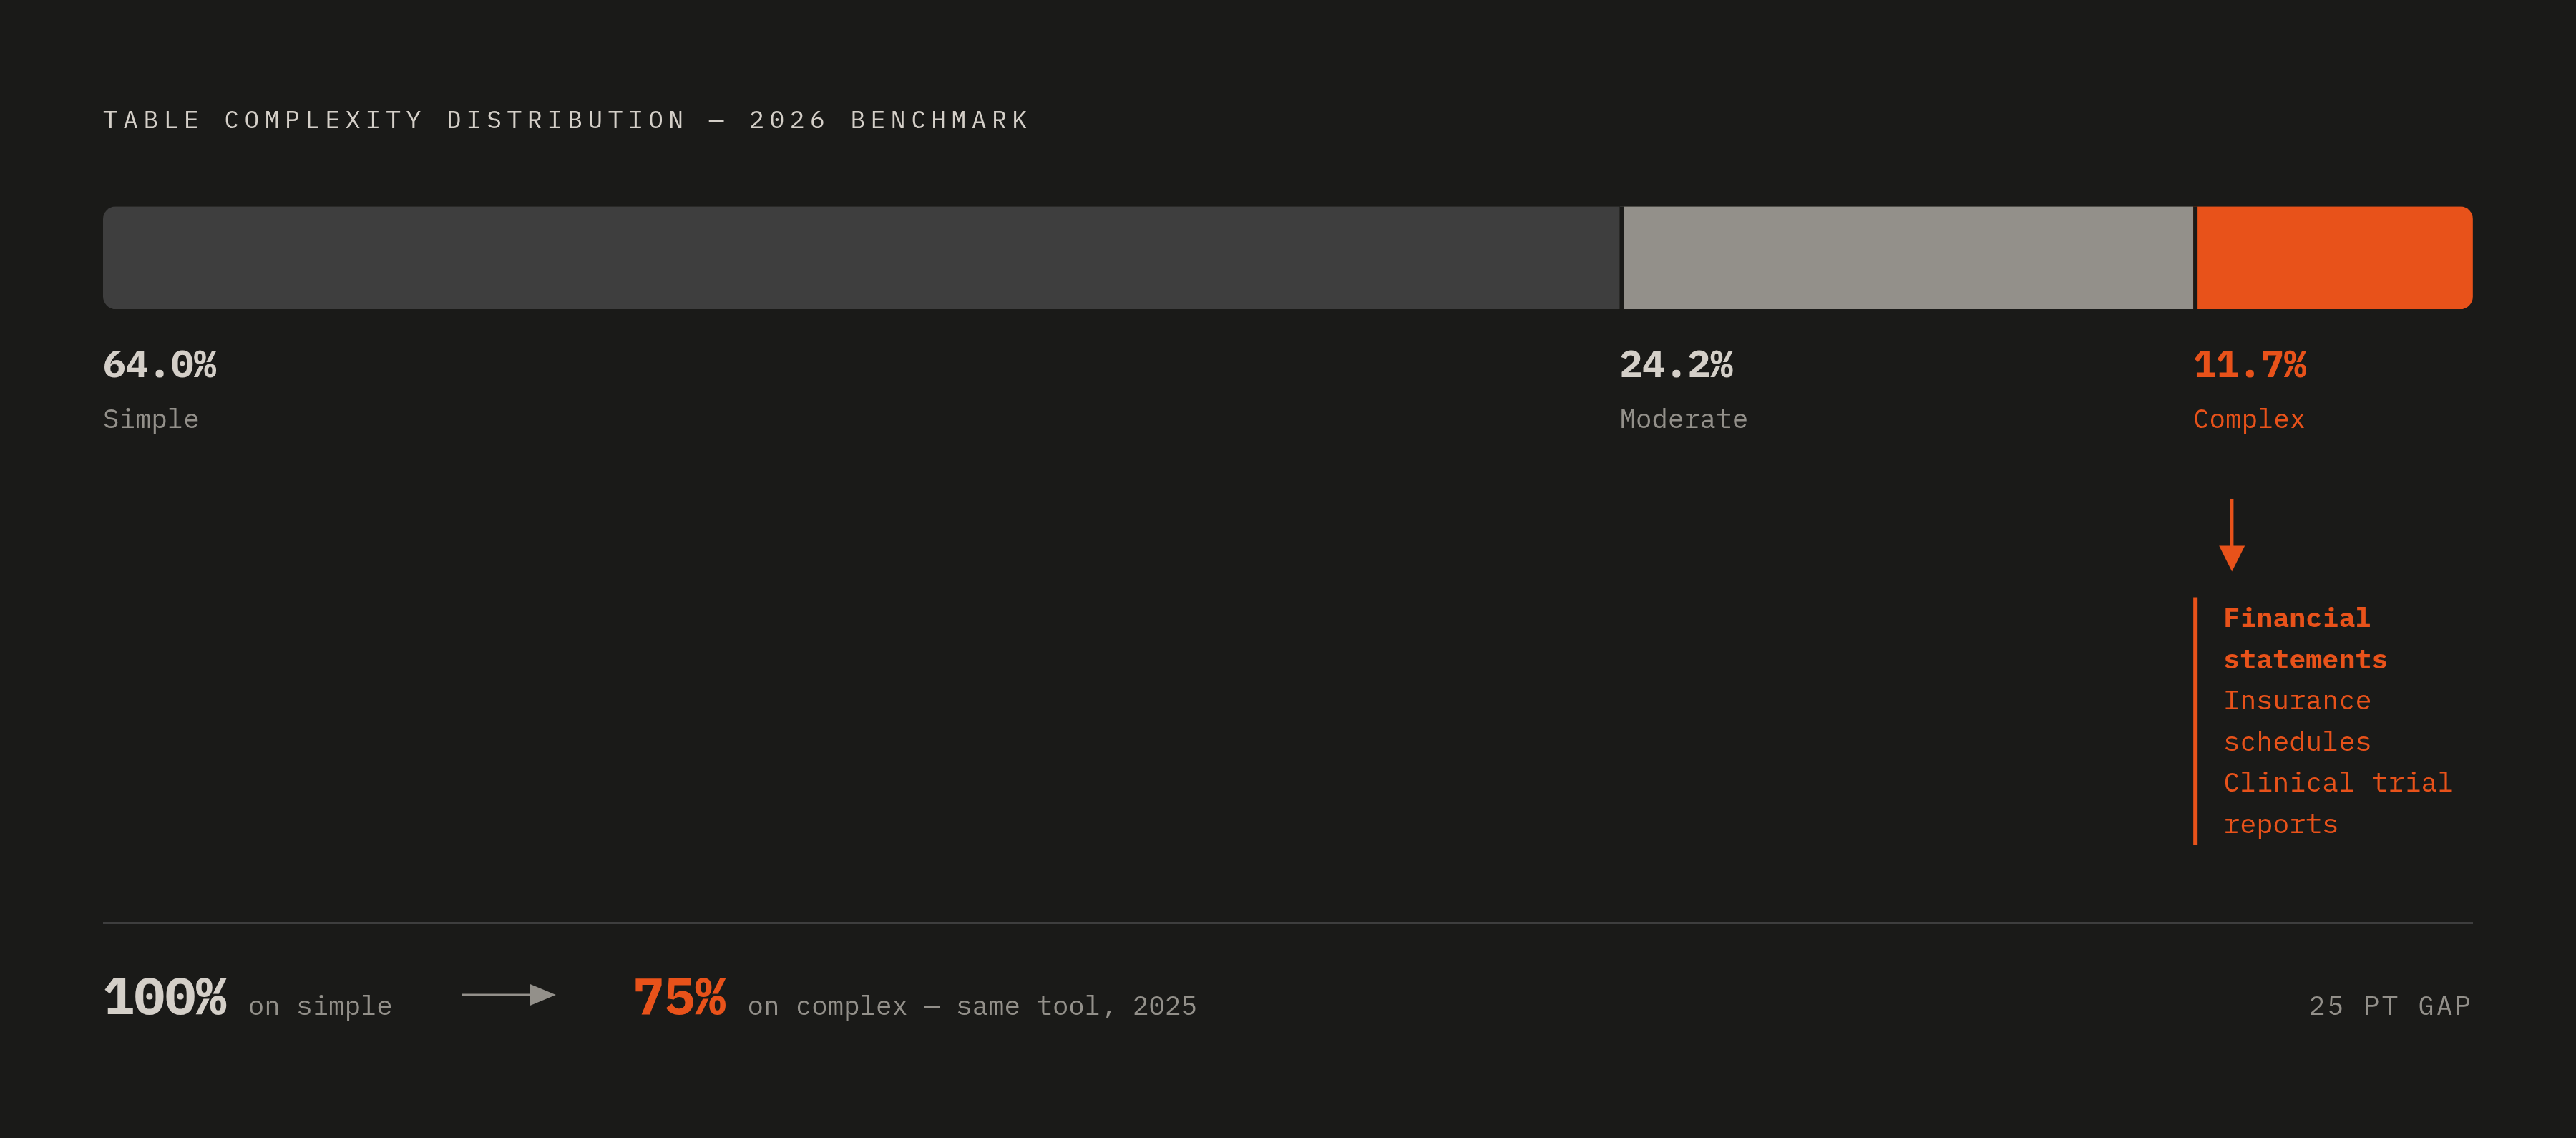
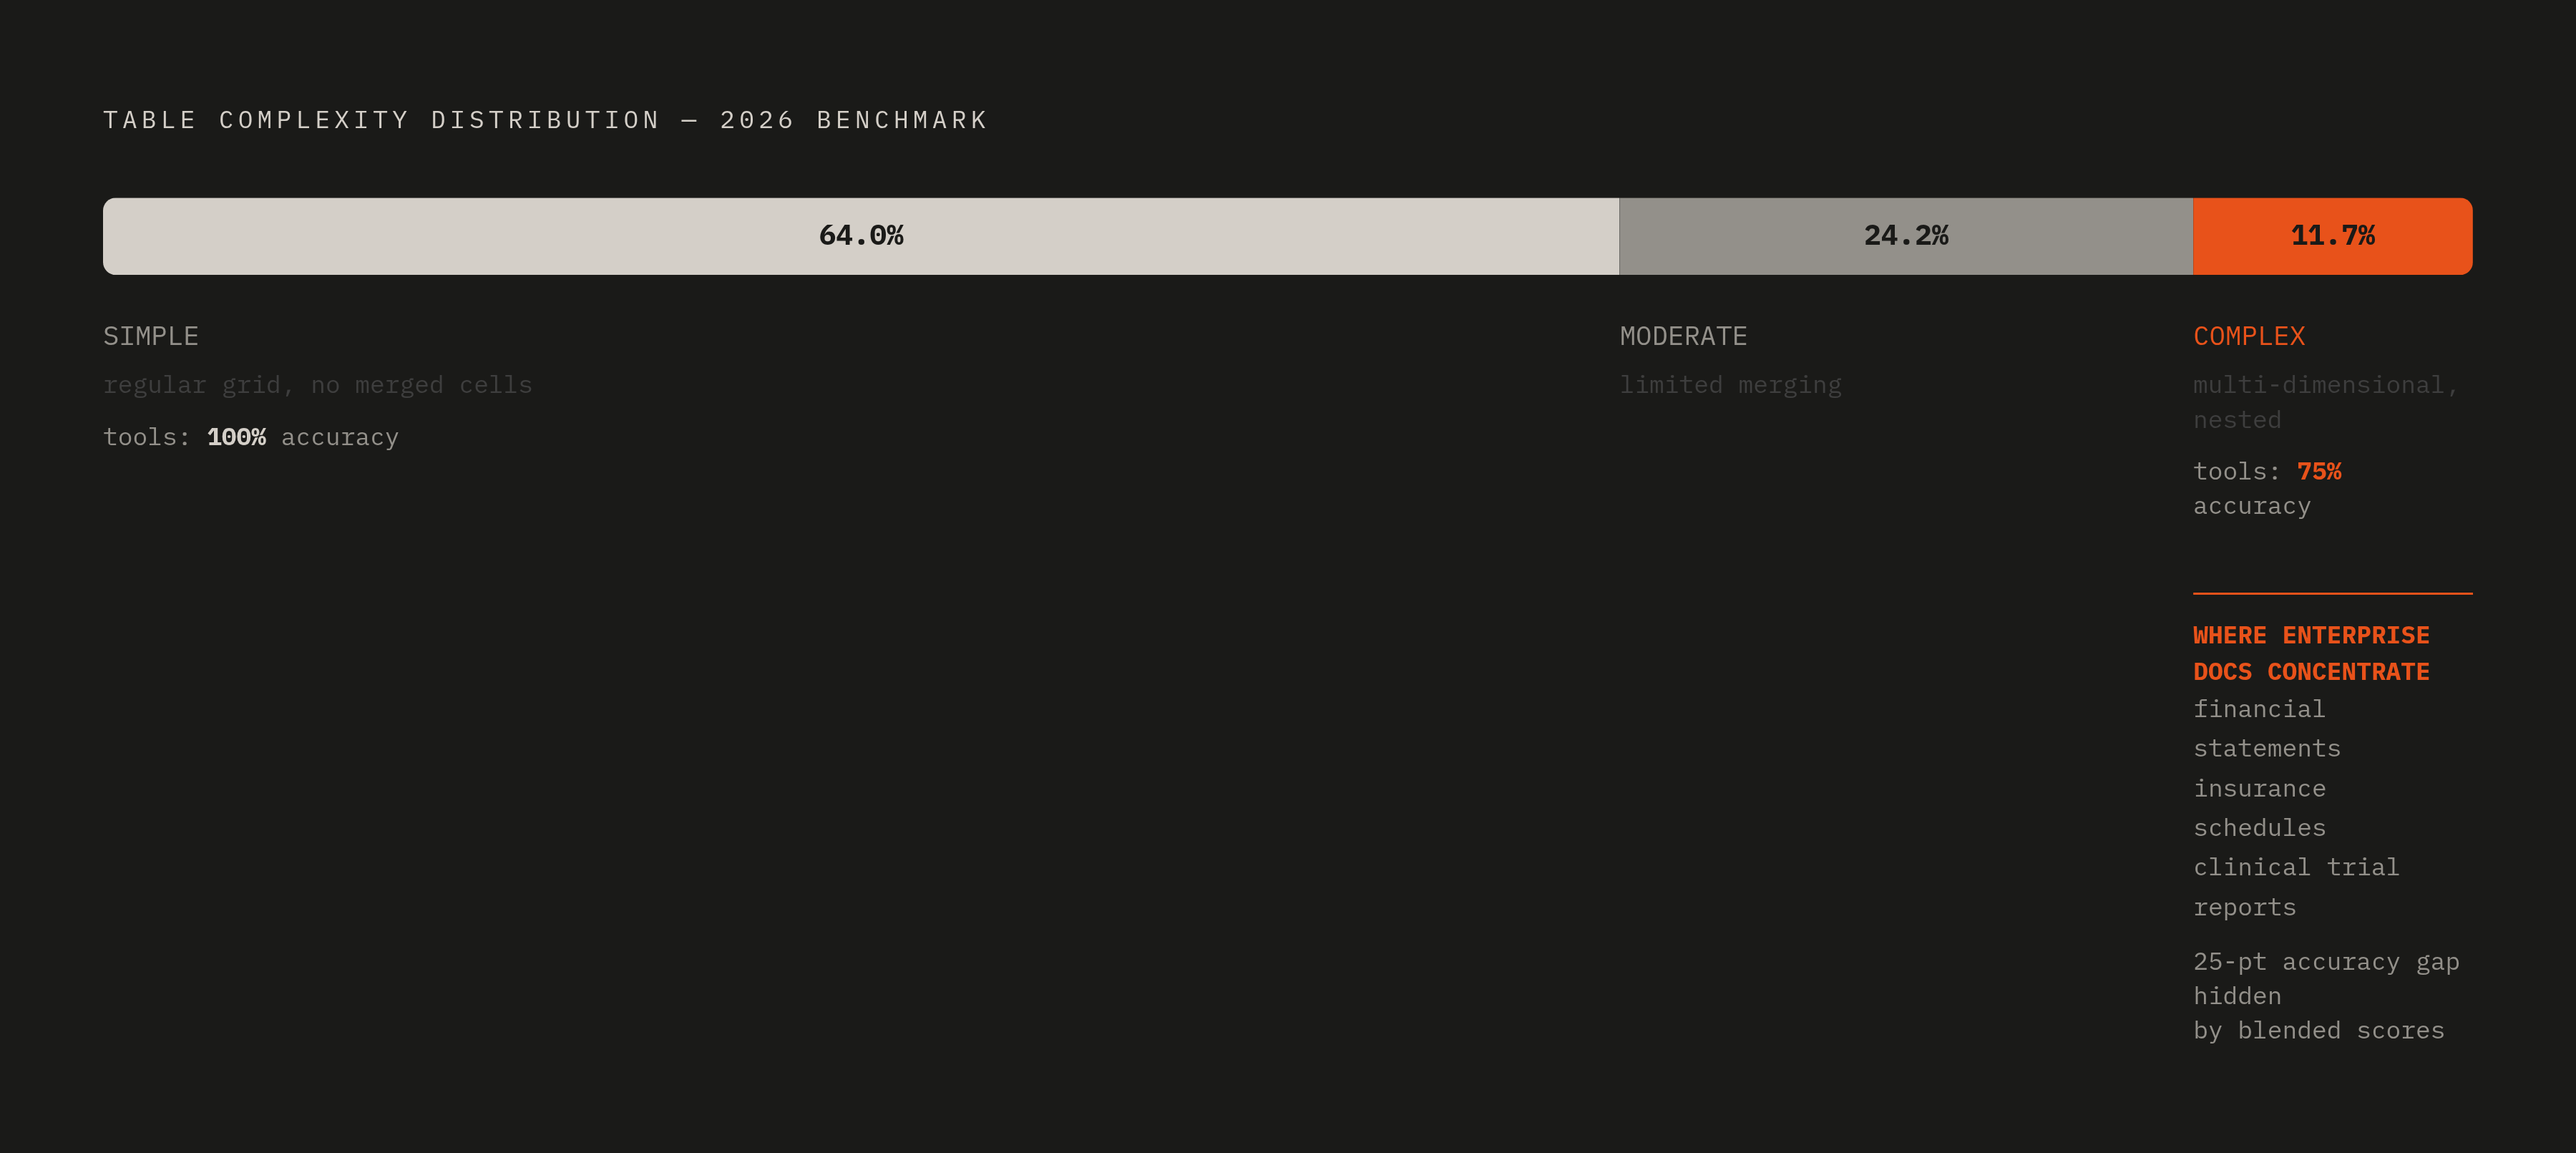
Complexity distribution matters here more than most benchmark writeups let on. A 2026 benchmark sorts tables into three buckets: simple tables with a regular grid and no merged cells at 64.0% of the population, moderate tables with limited merging at 24.2%, and complex tables with multi-dimensional or nested structure at 11.7%. That last figure sounds small until it becomes clear it's exactly the shape of table that shows up constantly in financial statements, insurance schedules, and clinical trial reports. The documents enterprises actually need parsed correctly come disproportionately from the hardest bucket, so a tool's overall accuracy number is close to meaningless unless it's broken out by complexity class. Anyone who cites a single blended accuracy figure without that breakdown is either hiding the weak spot or hasn't gone looking for it.
One end-to-end multi-task model reported a TEDS-structure score of 98.79% on FinTabNet, more than 7.7 percentage points above earlier table-specific models, and that gap says something real: architectural choices made at the structure recognition stage move the needle more than further tuning of OCR alone. Docling, from IBM Research, deserves naming specifically for its table structure handling; it appeals to teams that need local processing instead of a cloud API call, usually for compliance reasons.
How benchmark design either reveals or hides these failure modes
TEDS, short for Tree Edit Distance-based Similarity, is the standard metric here. Both the predicted table and the ground-truth table get represented as HTML trees, row and column spans encoded structurally, character content sitting at the leaf nodes, and the metric measures how far apart those two trees sit. GriTS offers a grid-level alternative to the same idea.
TEDS has a real weakness on messy, real-world documents: it mixes up formatting differences with genuine structural errors. A table that's structurally correct but uses different whitespace conventions can score lower than a table that's actually wrong but happens to land character-close to the ground truth. That's not a footnote-level quirk. It means two systems posting identical TEDS scores can differ enormously in whether their output is usable at all.
Dataset composition compounds the problem. PubTables-1M, one of the most widely used benchmarks, draws its documents from PubMed Central: academic papers produced under consistent, structured publishing workflows. That's about as far from a scanned insurance form or a faxed logistics manifest as a document can get, and treating a strong PubTables score as proof a tool is production-ready is a mistake worth naming outright. PubTables-v2 extends the same idea to 467,000 pages and 548,000 tables using full-page extraction, a real improvement in scale, though it's still built from the same clean, typeset source population. Table-arXiv takes a different angle on the same gap, drawing 41,090 valid tables from 18,676 arXiv papers under redistributable licenses, sampled from arXiv submissions in December 2025 across every subject area, which at least broadens the document population under test.
Cropped-table datasets carry their own blind spot. Hand a system a pre-cropped image of just the table, and the benchmark never tests whether the system could have found that table on the page in the first place. Table localization gets evaluated nowhere, so a strong score on a cropped-table benchmark only partially predicts how a full pipeline performs on a real, uncropped page.
Benchmark gaming is a live risk, not a theoretical one. LongExtractionBench, built from 225 documents averaging 358 pages each with roughly 88,700 ground-truth leaf values apiece, shows systems posting high precision or strong leaf-level accuracy while recall and overall coverage lag well behind. The headline number looks great, and the row-dropping problem hides underneath it. A similar split showed up in a 2025 benchmark where a tool hit 100% accuracy on simple tables but only 75% on complex ones, a 25-point gap that a single blended accuracy score, weighted toward the easy cases, would paper over entirely. Good benchmark design has to report results stratified by complexity class, broken out by language, with structural accuracy reported separately from content accuracy, and it has to penalize dropped rows directly rather than just scoring whatever rows made it into the output. OmniDocBench, built from 1,403 PDF files and presented at CVPR 2025, evaluates tables at an attribute level of granularity, a genuine step forward, but it only covers English and Chinese, which limits how much it can say about multilingual enterprise deployments.
Field relationship inference: the stage that determines whether extracted data is actually usable
Field relationship inference answers a deceptively simple question: what does this cell actually mean? Which header governs it, is it a subtotal or a primary line item, does it carry a unit or a footnote reference that changes its meaning entirely?
This is measurably harder on scanned documents than on native PDFs. A native PDF often carries positional metadata that can anchor a cell to its header even when the visual layout is ambiguous. A scanned document has none of that, so the system has to infer the relationship from visual proximity and content semantics alone, with no metadata safety net underneath it.
Three failure categories recur. Header attribution errors happen when irregular column widths push a value under the wrong header, especially beneath a spanning header that doesn't line up cleanly with the columns underneath it. Unit and qualifier loss happens when a number gets pulled out without the row or column that tells you what it means, so a figure like "$1.2M" comes out as a bare number, currency symbol and scale both gone. Footnote entanglement happens when a superscript marker inside a cell gets read as part of the value itself, or when a footnote row at the bottom of a table gets treated as one more row of data.
One benchmark result is worth citing here because it isolates exactly this stage: a reported DocVQA result of very high accuracy across the vast majority of questions measured whether a language model could answer questions using nothing but a parsed API response, with no access to the original image. That's a direct test of whether field relationships survived the extraction pipeline intact; if the model can answer correctly from structured output alone, the relationships between cells and headers made it through. This is exactly where controlled benchmark accuracy and production accuracy part ways: a system can post excellent numbers on a structure metric while quietly handing back field-level output a downstream agent can't act on with any confidence. Field relationship inference deserves its own validation step. Treating it as something that falls out automatically once structure recognition is done is how bad numbers end up sitting in a financial model, unflagged, waiting to be trusted.
What production-grade accuracy actually requires from a table extraction system
Accuracy targets need to be stratified by complexity, full stop. Hitting very high accuracy on simple, regular-grid tables says almost nothing about performance on complex, merged-cell, multi-page tables, and a production requirement that doesn't name which complexity class it's talking about isn't really a requirement. It's a marketing number wearing a requirement's clothes.
Confidence scoring belongs in the output, not bolted on afterward. A table extraction system should be able to say, per field or per table, how confident it is, so a downstream agent can route the shaky results to a human reviewer instead of letting a wrong number flow silently into a financial model or a claims system.
Row-drop detection deserves particular attention, because silently omitted rows are one of the most dangerous failure modes in large tables: the output looks clean and complete, with no obvious signal anything is missing. Evaluation has to penalize omissions directly instead of just scoring whatever rows happened to survive. Docling's reported 97.9% on complex sustainability report tables, set against a 75% figure for complex structures from another tool in the same 2025 benchmark, shows how wide that gap runs even among serious, well-regarded systems.
End-to-end evaluation on full pages beats evaluation on pre-cropped table images, because cropped-table scores never test whether the system could find the table in the first place. Academic benchmark numbers from PubMed or arXiv documents, however well built, won't tell an engineer whether a given pipeline handles a specific company's financial statements, insurance intake forms, or shipping manifests. Building or sourcing a test set drawn from the actual document population a system will face in production is close to a prerequisite for trusting any of this. Google Cloud's Document AI, with its specialized parsers and built-in human validation workflows, and Docling, with its local-processing model, sit at different points on the accuracy-compliance-cost tradeoff. Test against a specific document distribution instead of leaning on either vendor's headline number.
How pipeline architecture choices interact with accuracy at each stage
Monolithic and modular pipelines trade off in predictable ways. A single VLM handling layout, OCR, and structure recognition in one pass shrinks the integration surface considerably, but it also makes per-stage debugging close to opaque; when something goes wrong, there's no clean seam to open and inspect. A modular pipeline, in the mold of SPARTAN's separated preprocessing, detection, structure parsing, OCR, and schema mapping stages, lets a team fix one stage without retraining or replacing the whole system. That's the stronger default for anyone running these pipelines in production rather than in a demo.
Preprocessing is where the highest leverage per engineering hour tends to sit, and it's the stage most teams underinvest in. Deskewing and denoising before the recognition stage moves accuracy more than swapping recognition models does, because the recognition stage can only work with what preprocessing hands it. The ceiling gets set at the start of the chain, not the end, and no amount of budget spent on a fancier model at the back of the pipeline buys that ceiling back.
Multi-page tables need deliberate pipeline logic built around them. A model that processes each page independently, with no memory of what came before, cannot reconstruct a continuation table. The header on page one and the rows on page three need a page-level context assembly step connecting them, and that step doesn't happen automatically just because the underlying model is capable.
Schema mapping is worth keeping as its own concern, separate from structure recognition. Using an LLM-driven post-processing step, the kind SPARTAN offers as an optional hook, to map extracted cells onto a target schema separates structure accuracy from semantic accuracy. That separation is where domain-specific accuracy gains tend to be most achievable, since a schema mapper can be tuned to a specific document type without touching the structure recognition stage at all.
There's also a latency and cost tradeoff that's easy to ignore until the bill arrives. Larger, more accurate VLMs cost more and run slower per page, so a pipeline that routes every document through the heaviest available model is probably overpaying for accuracy it doesn't need on the easy cases. Matching model weight to document complexity, sending simple tables to a lighter, cheaper model and reserving the heavier model for complex or high-value documents, is a design decision, not an afterthought. The surrounding system, meaning preprocessing quality, context assembly across pages, schema mapping, and confidence-based routing, tends to determine production accuracy more than which frontier model sits at the recognition stage.
Evaluating table extraction tools against real documents from your domain
Start with a complexity audit of the actual document population in question. What share of the tables have merged cells, spanning headers, or continuation across multiple pages? The 64/24/11 split for simple, moderate, and complex tables from the 2026 benchmark is a reasonable starting reference, but most enterprise verticals, financial services and healthcare especially, skew far heavier toward the complex end than that general distribution suggests.
Build a domain-representative test set before evaluating any vendor or tool. That set needs the hardest table types in the document population, not just the typical ones, and ground truth needs to be annotated at the cell level rather than the document level, or the resulting comparison won't catch the failures that matter.
Four things are worth checking specifically. Structure accuracy on merged and spanning cells, measured on its own instead of folded into an aggregate TEDS score. Row coverage: whether every row that should be in the output actually shows up, with omissions penalized rather than ignored. Field attribution accuracy: whether extracted values land under the correct header rather than one column over. And multi-page reconstruction: whether a table spanning several pages gets reassembled as one table rather than several disconnected fragments.
None of this is glamorous work, and none of it produces a single clean number that settles the question once and for all. Table extraction from scanned documents stays a six-stage pipeline, and the honest answer to "how accurate is this tool" is always "accurate at which stage, on which complexity class, measured how." Anyone selling a single number instead of that answer is selling something.